Anomaly Detection: A Machine Learning Use Case
Kuang Hao, Research Computing, NUS IT
Anomaly detection is mainly a data-mining process and is widely used in behavioral analysis to determine types of anomaly occurring in a given data set. It’s applicable in domains such as fraud detection, intrusion detection, fault detection and system health monitoring in sensor networks. Since the definition of anomaly is often complicated, and depending on historical data, machine learning is optimal for this type of application.
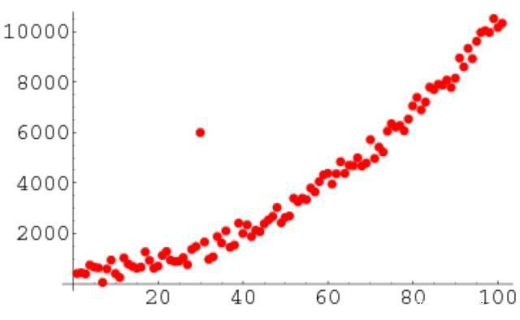
In this article, I will introduce several common machine learning methods to perform anomaly detection, and demonstrate how we can do that on our HPC cluster. I will perform benchmarking experiment on above methods with the same dataset to compare results of anomaly detected. Please find the experiment notebook here. The benchmark dataset used is also introduced in the notebook.
PCA
Principal component analysis (PCA) is a multivariate technique that analyzes a dataset in which observations are described by several inter-correlated quantitative dependent variables. Its goal is to extract only the important information from the data, to represent it as a set of new orthogonal variables called principal components, and to display the pattern of similarity of the observations and of the variables as points in maps. [1]
The principle of PCA is to map the original data into a new low-dimensional space by constructing a new feature space. PCA can improve the computing performance of data and alleviate “Curse of Dimensionality”. (When the dimension increases, data will become extremely sparse, making calculations of distance and density difficult, and the complexity of subspace growing exponentially)
During anomaly detection, PCA is used to cluster datasets in an unsupervised manner. Points that are far from the cluster are considered as anomalies. Since we don’t need labelled and balanced data here, PCA is generally good for common anomaly detection tasks.
To use PCA, we need the package “scikit-learn”. For installation and environment setting, please refer to the manual “Python on CPUs” on NUSIT website.
Then we need to standardize our data (scaler):

After that, we need to initiate a PCA object and perform simple unsupervised learning. By default all components are kept. We choose to keep 2 features here, so we need to standardize the 2 features too.

Finally we measure distance between data points to nearest centroid and define anomaly as those who are furthest. Here we use K-Means to calculate centroids.

Here is the result, where a red point marks an anomaly detected:
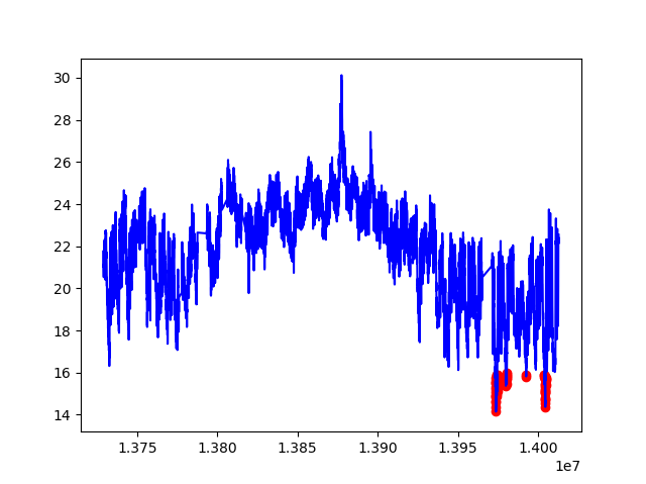
From the plotted graph we can see that PCA, or general cluster method detects the low temperature around the end of record as unusually low. It doesn’t detect the highest temperature as an anomaly.
Isolation Forest
Isolation Forest (or iForest) can be understood as unsupervised random forest. It builds an ensemble of trees for a given dataset, then anomalies are those instances which have short average path lengths on the trees. There are only two variables in this method: the number of trees to build and the sub-sampling size. We show that iForest’s detection performance converges quickly with a very small number of trees, and it only requires a small sub-sampling size to achieve high detection performance with high efficiency. [2]
The implementation of iForest is simpler than PCA. Note that the default contamination (proportion of outliers) is too large, so here I use “outliers_fraction = 0.01”.

Plotting results is also more straightforward, since the prediction is already what we need:
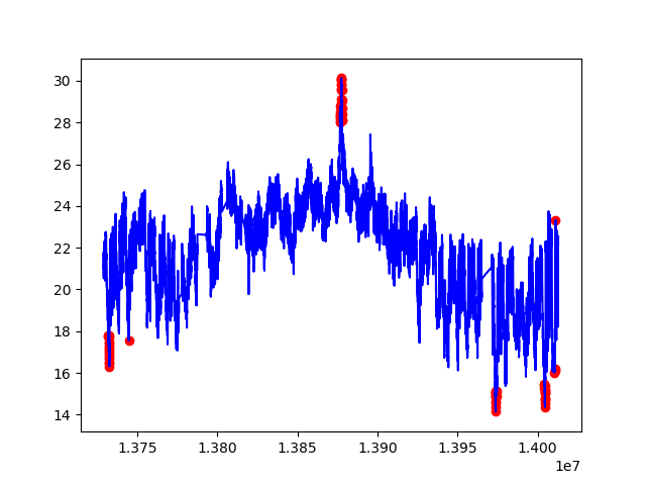
From the graph we see that high values are also detected, which shows iForest’s advantage in working with different data repartitions.
One-Class SVM
Support Vector Machine (SVM), one of the most popular classifier in supervised learning, can also be used in anomaly detection. Different than traditional SVM, we use One-Class SVM for anomaly detection. The principle of OC SVM is to find a hyperplane that circles all sample in the training data. And prediction will use this hyperplane to make decisions. New samples outside the hyperplane are considered negative samples. It is performant for biased dataset and intuitively suitable for anomaly detection. But because the kernel calculation of OC SVM is time-consuming, it is not widely used in terms of massive data.
Implementation part is similar to iForest. Result plot:
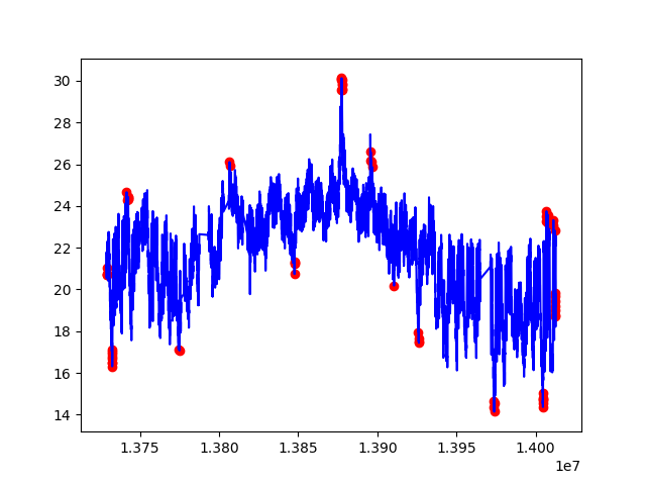
From the above graph we can see that OC SVM is good for multimodal data. It is especially powerful in novelty detection, where no anomalies are shown in the training set.
RNN
Recurrent Neural Network (RNN) is a type of advanced artificial neural network (ANN) that involves directed cycles in memory. [3] Because RNN has memory (hidden state) and works well on sequential data, RNN is widely used in common NLP applications.
To use RNN for anomaly detection, here we define an anomaly when the next data points are distant from RNN prediction. Aggregation, size of sequence and size of prediction for anomaly are important parameters to have relevant detection. [4] For the experiment we learn from 50 previous values, and then predict just 1 next value. To do so, we need a unroll function that provides a sequence of n=50 previous data points for every data point:

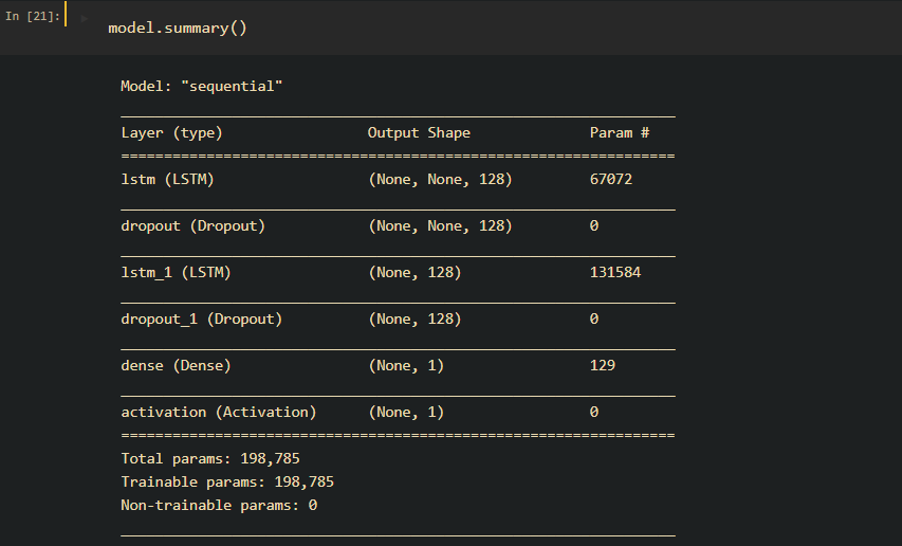
After preprocessing, we build the model with a simple stacked LSTM layers. Here is the model structure:
For prediction, similar to PCA, we need to set a threshold to find instances that are far from normal. Here is the final result:
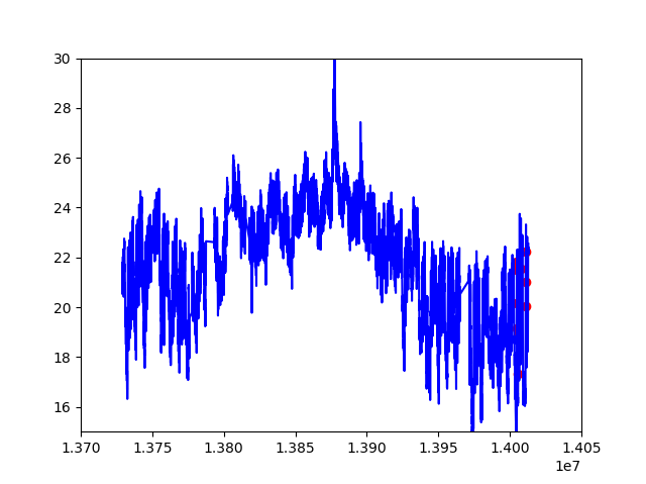
We can see that with neural nets, we don’t see a more significant result. Of course, we can tune our threshold for optimization, but usually for structured data, machine learning methods are sufficient. RNNs are more powerful for unstructured contextual data.
Note that deep learning (GPU) applications are accessible through containers on HPC clusters, which differs from normal CPU Python applications. Please find our manuals for deep learning and other applications on HPC here.
Conclusion
This article aims to introduce common machine learning approaches in anomaly detection.
Through the experiment we find that iForest and OC SVM works well on anomaly detection for benchmarking unordered data. Empirically, cluster method (PCA) and iForest are good for collective unordered anomalies, Markov chains are good for sequential ordered anomalies, OC SVM is good for novelty detection, and RNN is good for contextual anomaly detection.
Python packages used in this article (sklearn, keras) are available on HPC clusters. Contact us if you have any issues using our HPC resources, via A.S.K.
Reference
[1]. Onacademic. (2010). Priciple component analysis. [online] Available at: https://www.onacademic.com/detail/journal_1000034199579210_f513.html
[2]. Liu, F. T. , Ting, K. M. , & Zhou, Z. H. . (2009). Isolation Forest. Data Mining, 2008. ICDM ’08. Eighth IEEE International Conference IEEE.
[3]. Goodfellow, I., Bengio, Y., Courville, A. .(2016). Deep learning (Vol. 1): Cambridge: MIT Press, 2016: 367-415
[4]. GitHub. (2017). Unsupervised_Anomaly_Detection. [online] Available at: https://github.com/Vicam/Unsupervised_Anomaly_Detection

