An AI-Trained Tool for HPC Parallel Job Performance Monitor and Optimisation
Wang Junhong, NUS IT – Research Computing
Many of you may face a common dilemma to understand how well your batch jobs are running once you submit them into the HPC system. You may request a compute node with 24 CPU cores to run a job, or even request 4 of such compute nodes for faster computing and shorter time to solution. However, in reality the expected good performance might not be achieved either because the program is not parallelised to run on multiple CPUs or multiple nodes, or an incorrect input was provided by mistake. Usually, you can find out the problem by checking the job’s output and the batch job summary report after the job is completed. But wouldn’t it be better if you could check and monitor the parallel computing performance of job while it is running in a batch queue, to save you precious time when you can correct any mistakes as early as possible .
The PBS job scheduler in the HPC system provides the information for you to check and monitor the running status of a batch job. However, there are too much information to be displayed over a quick and concise overview so to overcome this shortfall, an AI-trained tool is developed to help you to check and find out how well your job is running in the system. Using this tool in the central HPC system, not only can you check and monitor the health status of a job, but also find out the computing performance. In addition, it offers suggestion on what you can do to correct any issues.
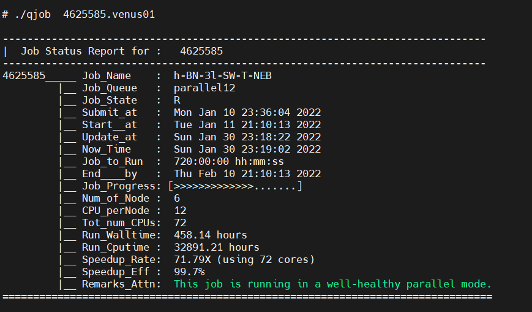
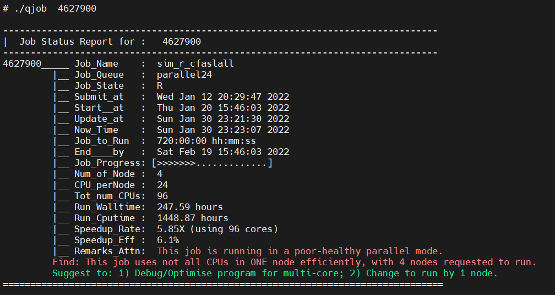
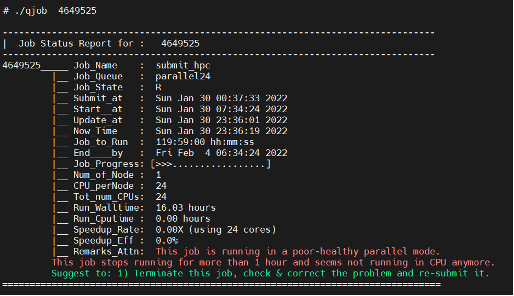
Please refer to the four examples below that illustrate the usage of this tool (qjob) in the HPC system.
|
Example 1: A job runs in well-healthy mode
|
Example 2: A job runs in subpar-healthy mode with suggestion provided
|
|
Example 3: A job runs in poor-healthy mode with suggestion provided
|
Example 4: A job runs in poor-healthy mode with suggestion provided
|
From the above examples, you can get to know the following information of jobs quickly:
- Job name, Job queue, Job submit/start/end time.
- CPUs and Compute Nodes requested for the job.
- Computing time vs CPU time and speedup rate and efficiency.
- Findings of parallel performance of the job and potential problem if any.
- Suggestion on correction of the problem.
- No suggestion is provided if the job runs healthy.
- Findings are highlighted in Orange/Red if there is performance issue for your attention.
Using this tool you could check and find out any potential problem(s) as early as possible, giving you the chance to correct the problem(s) immediately. This will improve the computing performance and shorten the computing time. This wouldimprove your overall productivity and efficiency. Moreover, it will also help to improve the utilisation of the central HPC resources as it helps to reduce the potential waste of idle CPU cycles.


