HANDY TOOLS CUSTOMISED FOR HPC PARALLEL COMPUTING
When you start to work on a high-performance computing (HPC) cluster to submit and run your computational jobs, you may want to know the available job queues for job submission and the load status in these queues in order to select an appreciate queue. After jobs are submitted and running in the queues, you may also want to know the computing speed and parallel computing performance of the jobs. Your program may generate a lot of data sets or result files which occupy large amount of storage space, so you may want to know the available storage space allocated to you and the usage.
On the central HPC clusters, three customised tools are enabled for you to achieve the above goals.
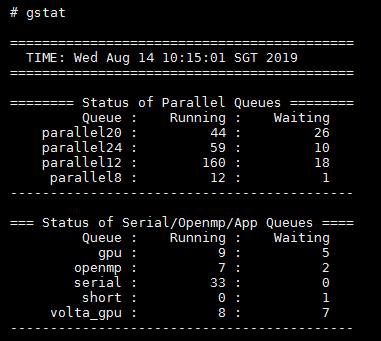
Tool 1, gstat: To check available job queues and load status
The tool “gstat” is customised to list out all the available job queues for parallel computing jobs, serial jobs and GPU jobs for deep learnings. Apart from listing the available job queues, it also shows the load status of the queues: where higher number of waiting jobs in a queue, means higher load/demand

Tool 2, qlist: To check and monitor parallel job speedup performance
The tool “qlist” is customised to list the memory usage, running time and cpu time, and also the speedup ratio and parallel scaling efficiency for the current running jobs. This will present a quick overview of your running jobs, thereafter to draw your attention if needed.
If the speedup ratio is far below the expected performance or if the efficiency is below 50%, the Eff status will be marked as [**] to capture your attention. Healthy jobs are marked as [OK] under this column and no action is expected.

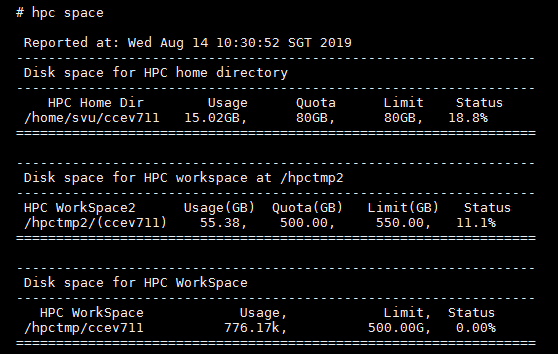
Tool 3, hpc: To check the available storage space and usage via “hpc space”
The tool “hpc” is customised for a few useful functions. Enter “hpc space” or “hpc s” on the HPC cluster, you can list the available storage space allocated to your account and the current usage.

There are a few other functions are integrated with the tool “hpc”. Feel free to use it to check out and list instructions that can help you.
| Command | Functions |
| # hpc DL|dl [batch] | To list out instructions and steps on running deep learning. |
| # hpc serial|parallelN | To list out sample script for job submission to queue serial or parallel requesting for 1 or , Nx CPUs or cores, where N can be 8, 12, 20, and 24. |
| # hpc pbs summary | To list out common steps and commands in using the PBS job scheduler for job submission, monitor and management. |
You can use the above 3 tools on the HPC cluster at any time. At the same time, the 3 tools are enabled to check and list load status of available job queues, to understand progress and performance of running jobs, and to check usage of allocated storage space automatically upon login to the HPC cluster.

